- April 8, 2023
- Posted by: CFA Society India
- Category:ExPress

Written By
Mihir Shirgaonkar, CFA
AVP - Alternative Investments, Phillip Ventures IFSC Pvt. Ltd.
Member - Public Awareness Committee, CFA Society India
Introduction
As of the end of the calendar year 2022, total assets managed globally under ESG funds were around USD 2.5 trillion. This value was 12% higher than the value of ESG funds as of the third quarter of CY 2022. This percentage growth in ESG assets was nearly double that of broader global fund assets for Q4-2022. As per Morningstar’s Sustainable Fund Flows data, Europe leads the pack of ESG fund assets with more than USD 2 trillion as of 2022-end [1]. Institutions and individuals are making increasing allocations to ESG-compliant assets as they pursue the objectives of making investments with a sizeable positive impact on numerous Environmental, Social, and Governance metrics. Investment professionals worldwide are divided on whether portfolios with ESG orientation deliver better returns than the broader markets over longer periods.
This article attempts to discuss the impact of ESG considerations on Indian large-cap equities (NIFTY 100) on select parameters. A comparison with the impact on US large-cap equities (S&P 500) has also been presented. An analysis of select statistical computations pertaining to the benchmarks of the nations is presented, followed by the conclusions that can be drawn from the data.
India Large-caps and Environmental, Social, and Governance (ESG) Considerations
The NIFTY 100 ESG Index is comprised of companies from within the universe of NIFTY 100 based on the Environmental, Social, and Governance (ESG) risk score. The weight of each constituent in the ESG benchmark is a function of the free-float market capitalization and the ESG risk score of the company. Presently, there are 89 companies in the NIFTY 100 ESG Index.
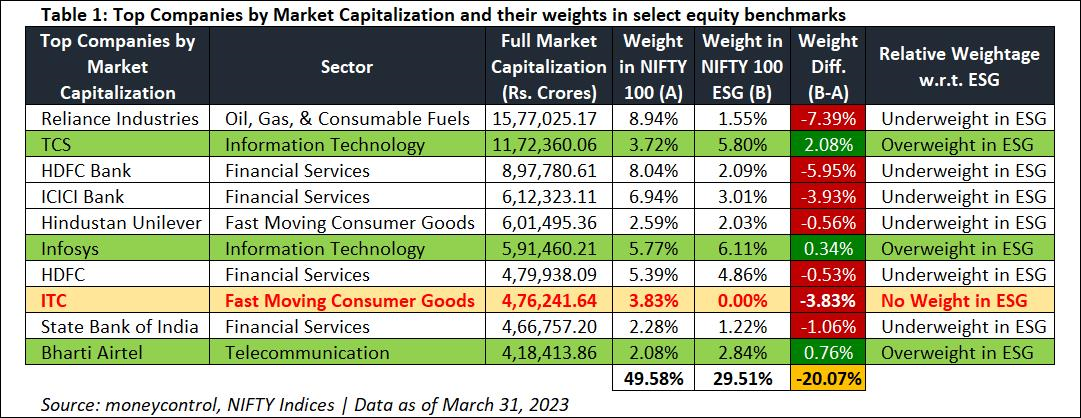
As can be seen in Table 1 below, 7 out of 10 of the largest companies by market capitalization in India are underweight in the NIFTY 100 ESG Index when compared with the NIFTY 100 Index. Some observations from the comparative analysis:
- The largest 10 companies constitute close to 50% of the NIFTY 100 benchmark.
- The above-mentioned companies are collectively underweight in the ESG counterpart of the NIFTY 100 Index by over 20%
- Reliance Industries Ltd. is significantly underweighted (7.39%) in the ESG benchmark
- ITC is altogether excluded from the ESG Index.
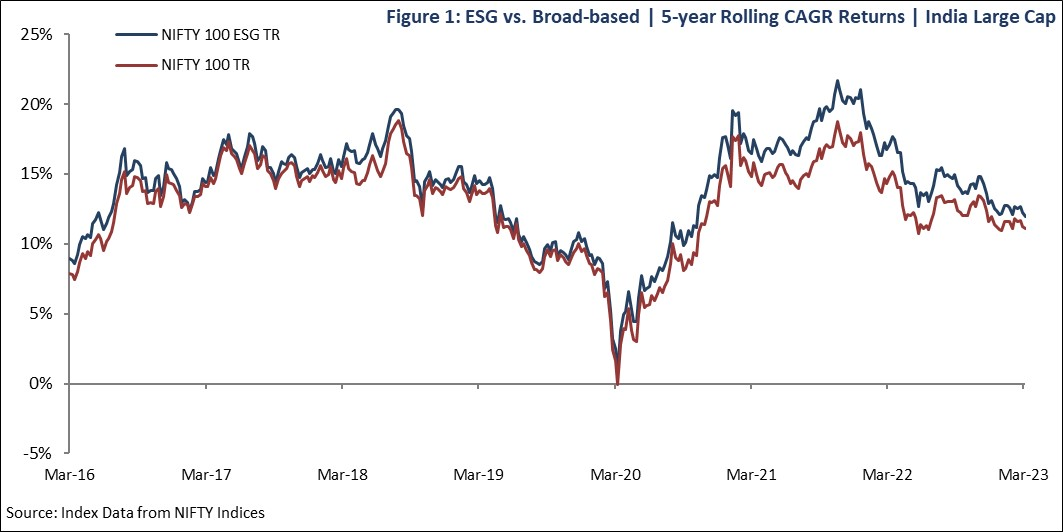
An analysis (Figure 1) of the 5-year rolling returns of the ESG and Broad-based benchmarks of the NIFTY 100 suggests that ESG returns have been consistently higher than those of the broad-market index over longer periods. We can draw the following conclusions from the above-observed returns:
- The relatively superior performance of ESG could be attributed to the ESG benchmark being overweight in the top performers and underweight in the bottom performers of the NIFTY 100 Index.
- The performance of the non-ESG constituents (100-89 = 11 companies) has consistently resulted in a downward drag on the overall returns of the NIFTY 100 Index relative to its ESG counterpart when observed over longer time frames.
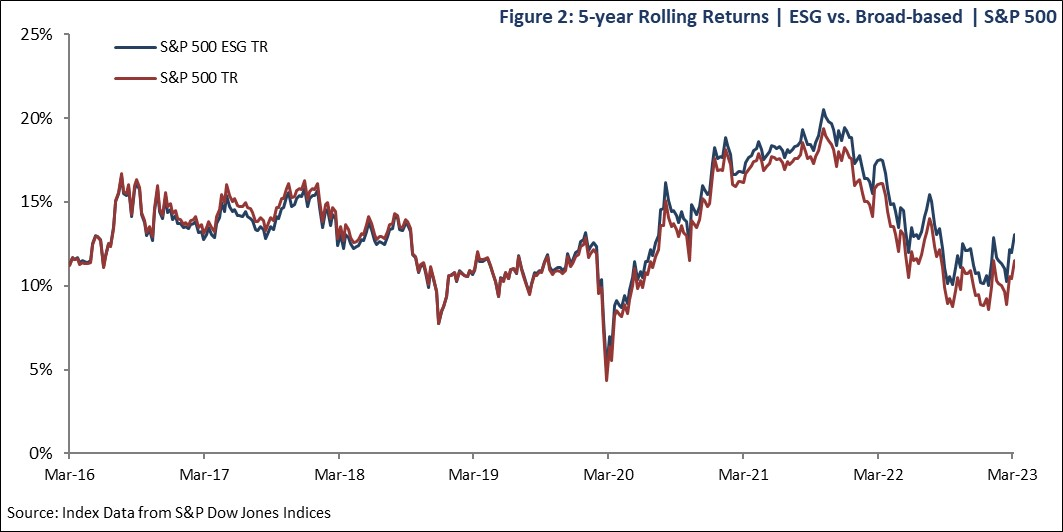
A comparison of the 5-year rolling returns (Figure 2) of ESG and Broad-based benchmarks of the S&P 500 Index reveals a similar outcome. However, in the case of the S&P 500 Index, ESG returns have been largely in line with those of the Broad-based benchmarks with ESG returns being marginally higher in recent years.
ESG Alpha over Shorter Periods
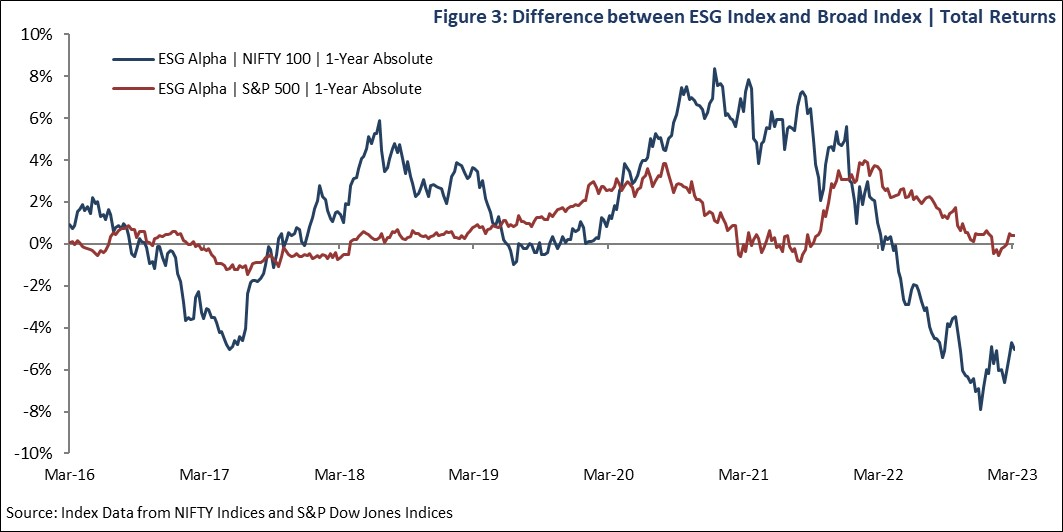
We can define ESG Alpha as the excess returns generated by an ESG benchmark over and above the returns of its corresponding underlying broad-based equity benchmark. An analysis of the ESG Alpha of large-cap equities in India (NIFTY 100) and those in the United States (S&P 500) reveals significant divergences between the two markets when observed over shorter time frames. A comparison of the 1-year rolling ESG Alpha values (Figure 3) of the two markets suggests that in the United States, ESG returns, particularly post-2018, have been greater than those of the broader benchmark with brief periods of at-par performance.
On the other hand, in the case of Indian large-caps (NIFTY 100), there is a huge variation in the relative performance of ESG vis-à-vis the broader index in terms of, both, outperformance and underperformance. It may also be noted that in the past two years, the NIFTY 100 ESG Index has significantly underperformed the broad-based NIFTY 100 Index. This could suggest that in the recent period, the major chunk of the Indian large-cap equity returns are driven by constituents that score low on ESG metrics. To put it differently, constituents with a high ESG tilt have underperformed those with a zero to low ESG score.
Correlation between ESG and Broad-based Indices
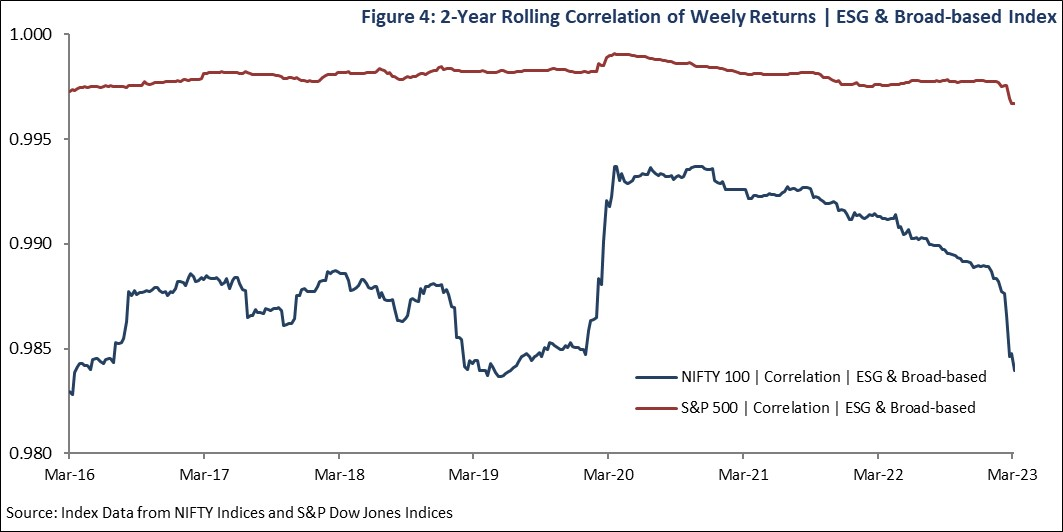
The impact of the recent underperformance of the NIFTY 100 ESG Index relative to the NIFTY 100 Index can also be seen in the change in the correlation between the two benchmarks. As can be seen the Figure 4, the 3-year rolling correlation between the ESG and Broad-based Index in the case of NIFTY 100 has undergone visible shifts over time. The recent trend points towards a weakening correlation though the correlation coefficient remains well above 0.95. On the other hand, the correlation between the S&P 500 Index and its ESG variant is near perfect with the correlation coefficient remaining largely upwards of 0.995.
Conclusion
As per the 2022 Burgundy Private Huran India 500 List, Reliance Industries alone contributes 8.9% to India’s GDP [2]. A lower weight of Reliance Industries in the NIFTY 100 ESG Index is due to its lower ESG score. Thus, the largest contributor to the country’s GDP fares low on ESG considerations considered for weightage in the NIFTY 100 ESG Index. Some of the largest companies in India by market capitalization, namely, Reliance Industries, HDFC Bank, and ICICI Bank have significantly lower weights in the ESG benchmark as a result of their low ESG scores. We can draw the following inferences:
- Low ESG scores of the largest firms in the country may indicate that the next leg of growth for the Indian economy, at least in the short term, is not aligned strongly with ESG considerations.
- The relative underperformance of ESG in recent times and the shrinking correlation between ESG and the Broad-based benchmarks may indicate that incorporating ESG considerations into India-focused investment portfolios could prove detrimental to investment returns in the current environment.
References
[1] Baker, Brian and Barba, Mercedes. (Updated 2023, January 31). ESG investing statistics 2023. Bankrate. https://www.bankrate.com/investing/esg-investing-statistics/
[2] Jain, Rounak. (Updated 2022, December 01). Adani may be the richest Indian but Ambani’s RIL retains the top spot on Hurun’s list of most valuable companies. Business Insider. Link to Article
Disclaimer: “Any views or opinions represented in this blog are personal and belong solely to the author and do not represent views of CFA Society India or those of people, institutions or organizations that the owner may or may not be associated with in professional or personal capacity, unless explicitly stated.”
About Mihir
Mihir Shirgaonkar, CFA heads the Alternative Investments division at Phillip Ventures IFSC Pvt. Ltd. and has been a part of the firm since 2021. He is a Chartered Accountant and has completed MBA-PGPX from the Indian Institute of Management Ahmedabad. He has over 8 years of asset management experience and has worked with DSP Investment Managers (erstwhile DSP BlackRock) and HDFC AMC in his previous roles. In his career so far, he has handled multiple areas which span portfolio management, market making, valuations, fund administration, and project management. His other interests include philosophy, reading, photography, trekking, coding, cooking, and travelling
